STAT2009 Statistics for Managerial Decision Assignment Sample
Question 1
Visit the Australian Stock Exchange website, https://www2.asx.com.au. Type in the ASX code “COL” (Coles Group Limited), and find out details about the company. Also, type in the ASX code “WOW” (Woolworths Group Limited), and find out the details about that company. Information available in the ASX website will be inadequate for your purpose, you will need to search the internet for more information. Your task will be to get the opening prices of COL and WOW shares for every quarter from January 2013 to December 2021 (unadjusted prices). If you are retrieving the monthly prices, read the values in the beginning of every Quarter (January, April, July, October) for every year from 2013 to 2021 (Total 36 observations). After you have researched share prices, answer the following questions for University Assignment Help -
(a) List all the quarterly opening price values in two tables, one for COL and the other for WOW. Then construct a stem-and-leaf display with one stem value in the middle, and COL leaves on the right side and WOW leaves on the left side. (Must use EXCEL or similar for the plot.) 1 mark
(b) Construct a relative frequency histogram for COL and a frequency polygon for WOW on the same graph with equal class widths”. Use two different colours for COL and WOW. Graph must be done in EXCEL or similar software. 1 mark
(c) Draw a bar chart of market capitals (or total assets) in 2021 (in million Australian dollars) of 5 companies listed in ASX that trade in similar products or do similar business as COL or WOW with at least AUD500 million in market capital. Graphs must be done in EXCEL or with similar software.
(d) If one wishes to invest in COL or WOW, what is the market recommendation (for example, from Morningstar, Fatprophets, InvestSmart, etc.)? If you cannot find the information, what would be your recommendation based on your research of these two companies (trend, P/E ratio, dividend yield, debt and Beta)?
Question 2
The table below lists the retail turnover by industry group between January 2018 and December 2018.
Retail turnover by industry group between Jan 2018 and Dec 2018 (in $ millions)
.png)
From the information provided in the table above
(a) Calculate the mean and standard deviation for each industry group.
(b) Calculate the Minimum, Q1, Median, Q3 and Maximum values for each industry group.
(c) Draw a box and whisker plot for the retail turnover of each industry group and put them side by side on one graph with the same scale for comparison. (This graph must be done in EXCEL or similar software and cannot be hand-drawn)
(d) Discuss the retail turnover and the trends of each industry group.
Question 3
The Table below is taken from the Australian Bureau of Statistics (ABS) website. It provides data on households use of the internet from Household Use of Information Technology Survey, Australia.
.png)
From the information provided in the table above,
(a) What is the probability that a randomly selected household lives in Tasmania?
(b) What is the probability that a randomly selected household lives in South Australia and accesses the internet for banking purpose?
(c) Given that a household lives in Western Australia, what is the probability that a randomly selected household accesses the internet for purchasing goods or services? What is the probability that a randomly selected household has accesses the internet for social networking or health services?
Question 4
Melbourne city council found that the average time of a regional train arrival at the Southern Cross station is normally distributed, with a mean of 31 minutes and a standard deviation of 2 minutes.
What value does the upper 5% of the time exceed?
A marketing company is conducting an experiment in which participants are to taste one of two different brands of tea. Their task is to correctly identify the brand tasted. A random sample of 300 participants is taken and it is assumed that the participants have no ability to distinguish between the two brands.
(i) What is the probability that the sample percentage of correct identifications is greater than 1
(ii) What is the probability that the sample will have between 70% and 80% of the identifications correct?
(iii) It is recorded that the length of action movies shown in a local cinema varies uniformly between 112 minutes and 135 minutes. What is the probability that the length of an action movie will be less than 121 minutes?
Question 5
A local university found that sixty four percent of business management students attend their lecture online. If a random sample of 300 students is selected, what is the approximate probability that at least 125 students actually attended their lecture online? Use normal approximation of the binomial distribution.
A shopping centre wants to estimate the mean time that shoppers spend at the shopping centre. Find the 95% confidence interval estimate of the mean given the following random sample (in minutes) of 124, 62, 80, 105, 115, 131, 84, 121, 92, 74.
Tourism Australia found that 172 out of 450 tourists postponed their travel plans after they had confirmed their travel dates. At 0.01 level of significance, is there evidence that the population proportion of tourists who confirmed their travel plans and postponed their travel dates is less than 0.50?
Answers-
Question 1
a) Quarterly opening price values one for Coles Group Limited and other one is for Woolworths Group Limited
Here, it is noteworthy that the company Coles Group Limited (COL) was listed on Nov 22, 2018 and thus, there is no quarterly opening price data before this period.
.png)
The stem and leaf display with STEM in the middle and COL leaves on right side and WOW leaves on the left side
.png)
b) The requisite relative frequency histogram and frequency polygon
.png)
c) The relevant total asset bar chart for five companies is as follows.
.png)
d) In order to recommend the appropriate stock investment between Woolworths and Coles, the following information obtained from Yahoo Finance is useful.
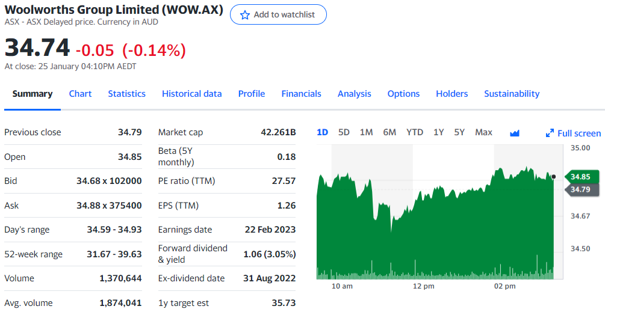
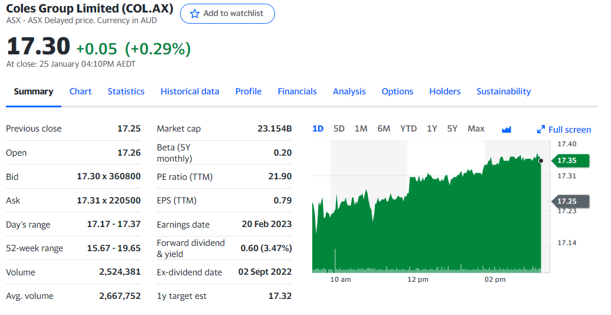
The data above highlights that P/E ratio for Woolworths is 27.57 as compared to 21.90 for Coles. This might indicate that the market expects more growth from Woolworths as compared to Coles. Additionally, the risk associated with Woolworths is also marginally lower than Coles based on the comparison of 5 year beta. Hence, Woolworths seems to be a more favourable investment choice.
Question 2
Mean and standard deviation for the retail turnover by industry groups in ($ millions)
.png)
Formula view
.png)
Minimum, first quartile (Q1), median, third quartile(Q3) and maximum values
.png)
Formula view
.png)
The box and whisker display
.png)
d) From the part (a) output, it is apparent that household goods have the highest average retail turnover for the given period. Further, the respective ranges of retail turnover and the box plot clearly highlight that across the various segments, retail turnover shows a significant variation. Additionally, boxplot confirms presence of outliers in the retail turnover data for almost all categories. The analysis clearly implies that retail turnover varies across the industry groups and also the months.
Question 3
.png)
Question 4
Let the required value is denoted by X.
Given data
Normal distribution
Mean (μ)= 31 minutes
Standard deviation (σ)= 2 minutes
95th percentile is indication of the upper 5% of time therefore, the corresponding z value from normal table comes out to be 1.645.
Formula for z score (X-μ)/(σ )=Z
Putting the values ((X-31)/2)=1.645
X=(1.645*2)+31
X=34.29 min
34.29 minutes is the value that upper 5% of the time exceeds.
(i) Let proportion of participants who have correctly identified the brand is 0.5. This means Probability of success (p) is also 0.50. Also, Total number of trials (N) would be 300 participants.
Binomial distribution
μ= (n*p) = (0.50*300) = 150
σ = √(Np(1-p) )= √(300*0.5*(1-0.5) )=5√3
“Probability that sample percent of correct identification greater than 55 is basically 55% of 300 which is 165.
Now, probability that correct identification of brand more than 165 is calculated using normal distribution.
=P(X>165)
= P((x-μ)/(σ )>(165-150)/(5√3))
=P(Z>1.732)
=1-P(Z<1.732) (From standard normal table)
=0.0416
Probability that sample will have between 70% and 80% of correct identification
Here, 70% indicates X1=70% of sample size = (0.70*300) = 210,
Also, 80% indicatesX2=80% of sample size = (0.80*300) = 240
=P(210<X<240)
= P((210-150)/(5√3)<Z<(240-150)/(5√3))
=P(6.92<Z<10.39)(From standard normal table)
=0
In this case, length of an action movies varies uniformly between 112 minutes and 135 minutes
Probability (Lengthof an action Lower Than 121 minutes)
=(121-112)/(135-112)
= 0.3913
Question 5
64% of Business Management students have attended their lecture online
Random sample (N) = 300 students
Proportion mean (p) = 0.640
Proportion (At least 125Business Managementstudents attended their lectureonline)
p'=125/300 = 0.4167
Normal approximation of binomial distribution
P(p>0.4167)
=P(Z>(p'-p)/√(p(1-p)/N))
=P(Z>((0.4167-0.64)/√((0.64*(1-0.64))/300)))
=P(Z>-8.0576)(From standard normal table)
=1
The 95% confidence interval
.png)
.png)
N = 10
Degree of freedom (N-1) = 9
Here, population standard deviation is not given and hence, t critical value would be used to determine the confidence interval.
T(critical) for 95% confidence and 9 degree of freedom = 2.2622 (t table)
LL = Mean-t*((Standard deviation)/√(Sample size ))
LL=98.80-2.2622*(23.70/√10)
LL=81.85
Now,
UL = Mean+t*((Standard deviation)/√(Sample size ))
UL=98.80+2.2622*(23.70/√10)
UL=115.75
95% confidence interval = [81.85 115.75]
It can be concluded with 95% confidence that population mean time in shopping at shopping center will fall between above interval.
Claim to test: Proportion of the tourists who have confirmed their travel plans and then postponed their travel dates is lower than 0.50.
One sample proportion Z hypothesis test
H_0: p≥0.5
H_a: p<0.5
Here total number of tourists who have confirmed their travel plans and then postponed their travel dates= 172
Sample number N = 450
Proportion p'=172/450 = 0.3822
Test statistics
z statistics=(p'-p)/√(p(1-p)/n)
z statistics= (0.3822-0.5)/√(0.5(1-0.5)/450)
z statistics =-4.9978
Level of significance = 1% or 0.01
Left tailed P value = 0.00
Observation: P value <Level of significance
Decision: Reject Ho and accept Ha
Finally, the claim of the Tourism Australia is correct that “Proportion of the tourists who have confirmed their travel plans and then postponed their travel dates is lower than 0.50.”
Would you like to schedule a callback?
Send us a message and we will get back to you
Main Services
- Accounting Assignment Help
- Accounting Assignment Helper
- Accounting Case Study Assignment Help
- Accounting Essay Help
- Assignment Help Adelaide
- Assignment Help Auckland
- Assignment Help Ballarat
- Assignment Help Bendigo
- Assignment Help Birmingham
- Assignment Help Brisbane
- Assignment Help Bristol
- Assignment Help Calgary
- Assignment Help Canberra
- Assignment Help Darwin
- Assignment Help Dubai
- Assignment Help Dublin
- Assignment Help Geelong
- Assignment Help Gold Coast
- Assignment Help Griffith
- Assignment Help Hamilton
- Assignment Help Hobart
- Assignment Help Liverpool
- Assignment Help London
- Assignment Help Manchester
- Assignment Help New York
- Assignment Help Newcastle
- Assignment Help Oxford
- Assignment Help Perth
- Assignment Help Sydney
- Assignment Help Toowoomba
- Assignment Help Toronto
- Assignment Help Wellington
- Assignment Writing Help
- AU
- Auditing Assignment Help
- Biology Assignment Help
- Bond University Assignment Help
- Business Accounting Assignment Help
- Buy Research Paper
- CA
- Case Study Help
- Corporate Accounting Assignment Help
- Cost Accounting Assignment Help
- Coursework Writing Help
- Curtin University Assignment Help
- Deakin University Assignment Help
- Dissertation Writing Help
- Do My Accounting Assignment
- Do My Accounting Papers
- Do My Finance Assignment
- Economics Assignment Help
- Engineering Assignment Help
- Essay Writing Help
- Federation University Assignment Help
- Finance Assignment Help
- Financial Planning Assignment Help
- Flinders University Assignment Help
- Holmes Institute Assignment Help
- Humanities Assignment Help
- IT Assignment Help
- JCU Assignment Help
- Kaplan Business School Assignment Help
- La Trobe University Assignment Help
- Law Assignment Help
- Leader Institute Assignment Help
- Management Assignment Help
- Managerial Accounting Assignment Help
- Mathematics Assignment Help
- Monash University Assignment Help
- MY
- Nursing Assignment Help
- NZ
- PIA University Assignment Help
- Programming Assignment Help
- Queensland University of Technology Assignment Hel
- Research Paper Help
- Research Paper Writers
- Research Paper Writing Help
- Research Paper Writing Service
- RMIT University Assignment Help
- Science Assignment Help
- SG
- Swinburne University of Technology Assignment Help
- Thesis Writing Help
- UAE
- UK
- UNSW Assignment Help
- US
- Victoria University Assessment Help
- VIT University Assignment Help
- Write My Assignment
- Write My Research Paper


Highlights
Earn While You Learn With Us
Confidentiality Agreement
Money Back Guarantee
Live Expert Sessions
550+ Ph.D Experts
21 Step Quality Check
100% Quality
24*7 Live Help
On Time Delivery
Plagiarism-Free
Our Samples
- DATA4000 Introduction to Business Analytics Case Study 1 Sample
- MCR007 Understanding Project Management Essay 1 Sample
- COIT20262 Advanced Network Security Report 2 Sample
- ECUR302 Mathematics in the Early Years Report Sample
- MBA5008 Business Research Methods Report 2 Sample
- MGT610 Organisational Best Practice Case Study 2 Sample
- COIT20249 Professional Skills in Information Communication Technology Report2 Sample
- TECH2300 Service and Operations Management in IT Case Study 2 Sample
- ECON7200 Economic Principles Report Sample
- MIS611 Information Systems Capstone Report 1 Sample
- MBA6204 Quantitative Support of Decision Making Report 3 Sample
- CPO442 Cybersecurity Principles and Organisational Practice Report 2 Sample
- TECH4100 UX and Design Thinking Report 2 Sample
- FE7066 Data Analysis for Global Business Coursework Sample
- 6006MHR Project Management Report Sample
- MIS611 Information Systems Capstone 3 A Report Sample
- MBA673 Business Analytics Life Cycle Report 2 Sample
- MBA5008 Business Research Methods Case Study 3 Sample
- CSE2AIF/CSE4002 Artificial Intelligence Fundamentals Report Sample
- MBA5008 Business Research Methods Report Sample
- OPS911 Strategic Procurement Management Report Sample
- MITS5502 Developing Enterprise Systems Report Sample
- MBA641 Strategic Project Management Report Sample
- Written Assessment Report 2 Sample
- MIS609 Data Management and Analytics Case Study 1 Sample
- Information Security PG Assignment Sample
- ENEG28001 Australian Engineering Practice Report 1 Sample
- NURS2021 Dimensions of Physical and Mental Health Case Study 3 Sample
- MBA6103 Agile Methodology Research Report 2 Sample
- MIS608 Agile Project Management Report 1 Sample
- ICT80011/40005 Energy Storage System Report Sample
- MGT602 Business Decision Analytics Report 3 Sample
- M33117 Public Policies and Labour Markets Report Sample
- MBA600 Capstone Strategy Report 2 Sample
- WPDD202 Webpage Design and Development Report 4 Sample
- MIS608 Agile Project Management Case Study 3 Sample
- SBM3204 Sustainability and Ethics Case Study Sample
- HI5031 Professional Issues in IS Ethics and Practice Case Study Sample
- Critically Examine and Identify the Issues within The Case Study from a Legal and Ethical Perspectiv
- TECH2200 IT Project Management Report 2 Sample
- Group of People Holding Papers Discussing White Laptop White Background Sample
- HA3011 Accounting Report Sample
- HDW204 Healthcare in the Digital World Report 1 Sample
- Economics for Business Assignment Sample
- ICT606 Machine Learning Report Sample
- ISYS1005 Systems Analysis and Design Report 3 Sample
- DATA4900 Innovation and Creativity in Business Analytics Report 3 Sample
- MECO6912 Political Public Relations Report 1 Sample
- MBA6201 Quality Management Essay Sample
- DATA4300 Data Security and Ethics Report 1 Sample
- ICC104 Introduction to Cloud Computing Report 2 Sample
- PRJ5106 Research Methodology and Data Analysis Assignment 2 Sample
- PBHL20001 Understanding Public Health Essay 3 Sample
- OPS910 Linear Programming Assignment Sample
- MIS610 Advanced Professional Practice Report 2 Sample
- BUECO5903 Business Economics Assignment Part B Assignment Sample
- EASC2702 Global Climate Change Report Sample
- MBA501 Dynamic Strategy and Disruptive Innovation Case Study 1 Sample
- SWOT Analysis of Chanel No5 Perfume Marketing 4ps Report
- HDW204 Healthcare in the Digital World Report 2 Sample
- MBA601 Fundamentals of Entrepreneurship Case Study 2 Sample
- Enem28001 fea for engineering design report sample
- BRM5002 Intercultural Awarness for Business Report Sample
- MIS100 Information Systems Case Study 2 Sample
- PLM Principles of Logistics Management Report Sample
- DATA4000 Introduction to Business Analytics Report 3
- MIS608 Agile Project Management Report 4 Sample
- DATA4000 Introduction to Business Analytics Report 3 Sample
- PRJ5001 Project Management Profession Case Study 3 Sample
- PUBH6008 Capstone A Applied Research Project in Public Health Report 2 Sample
- Planning in Health and Social Care Essay Sample
- MIS605 Systems Analysis and Design Assignment 1 Sample
- MN691 Research Methods and Project Design Report Sample
- ICC104 Introduction to Cloud Computing Report 3 Sample
- DATA4500 Social Media Analytics Case Study Sample
- M5011 Accounting for Management Report Sample
- MIS608 Agile Project Management Report 2 Sample
- Journal Article Review Report 4 Sample
- ADM80001 Nanofabrication Technologies Report Sample
- ICT504 IT Project Management Report 2 Sample
- EMS5RCE Risk Engineering Report 2 Sample
- MEE80003 Automation Strategy Case Study Sample
- TO5103 Global Destination Competitiveness Report Sample
- DSMG29001 Disaster Risk Reduction Report Sample
- PRJ5001 Project Management Profession Report Sample
- Australian Migration Law Assignment Sample
- MBIS5010 Professional Practice in Information Systems Case Study 3 Sample
- PPMP20007 Project Management Concept Report Sample
- MGT601 Dynamic Leadership Report 1 Sample
- MGT604 Strategic Management Report 3 Sample
- MN7002 International Business Strategy Report Sample
- MGT605 Business Capstone Project Report 1 Sample
- MITS6004 Enterprise Systems Report 1 Sample
- MG304 Agriculture Value Chain Management Case Study 2 Sample
- EDU10005 Indigenous Education and Perspectives Essay 2 Sample
- INFS2036 Business Intelligence Report 1 Sample
- NURBN1016 Primary Health Essay 2 Sample
- DATA4900 Innovation and Creativity in Business Analytics Report 4 Sample
- MIS610 Advanced Professional Practice Report 3 Part A Sample
- EDU40002 Play and Environment Report 2 Sample
- ENGR8931 Geotechnical Engineering GE 1st Copy Sample
- MIS604 Requirement Engineering Report 1 Sample
- DSMG2002 Exploring Emergency in Disaster Management Research Report 1 Sample
- HCCSSD103 Mental Health Case Study 3 Sample
- DATA4000 Introduction to Business Analytics Report 2 Sample
- MIS500 Foundations of Information Systems Report 1 Sample
- ECE6012 Professional Practice Report 1 Sample
- MBIS5009 Business Analytics Report Sample
- ACCT6006 Auditing Theory and Practice Case Study Sample
- TEC100 Introduction to Information Technology Report 2 Sample
- BUS6302 Integrated Marketing Communications Report 1 Sample
- MANM376 International Finance Project Report Sample
- MBA402 Governance, Ethics and Sustainability Report 3 Sample
- ENEG11005 Introduction To Contemporary Engineering Report Sample
- Management Essay Sample
- PRJ5106 Research Methodology and Data Analysis Report 4 Sample
- HI5029 IS Project Management Report Sample
- NURBN2026 Person Centered Nursing Sample
- BUS5DWR Data Wrangling and R Report 3 Sample
- Rich Picture CATWOE and Root Definition Report Sample
- ACCT6007 Financial Accounting Theory and Practice Report 2 Sample
- MBIS4009 Professional Practice in Information Systems Essay Sample
- MIS604 Requirements Engineering Case Study 1 Sample
- TECH2300 Service and Operations Management in IT Report 3 Sample
- CAS101 Community Development Report 2 Sample
- TUM202 Therapeutic use of Medicines Report 2 Sample
- COIT20249 Professional Skills in Information Communication Technology Report 2 Sample
- TECH1300 Information Systems in Business Case Study 2 Sample
- HI5017 Managerial Accounting Report Sample
- CCB102 Multimedia Design Report 1 Sample
- MIS605 Systems Analysis and Design Report Sample
- Health and Social Care in Emergencies and Disasters Report 3 Sample
- TCHR3001 Early Childhood Matters Report 2 Sample
- CAP203 Care of the person with an acute illness Case Study 2 Sample
- MIS775 Decision Modelling for Business Analytics Report Sample
- BE969 Research Methods in Management and Marketing Sample
- GDECE101 Early Childhood Care and Education Report Sample
- OPS802 Operations Management Report 3 Sample
- HI6008 Business Research Project Report Sample
- ETCH304 Diverse Literacy and Numeracy Learners Report 1 Sample
- MGT502 Business Communication Report 1B Sample
- HI5004 Marketing Management Assignment Sample
- AC400 Agribusiness Accounting Report 2 Sample
- MIS500 Foundations of Information Systems Report Sample
- MOB6110 Creating Entrepreneurial Leaders Report Sample
- INT101 Introduction to International Relations and Politics Essay Sample
- HI6032 Leveraging IT for Business Advantage Report 1 Sample
- Principles of Economics Assignment Sample
- PSYC2017 Personality and Individual Differences Research Report Sample
- NURBN1012 Legal & Ethical Decision Making in Person Centred Care Sample
- PPMP20009 Control Charts and Process Mapping Assignment Sample
- PPMP20009 Case Study Sample
- SITHCC001 Use Food Preparation Equipment Assignment 2 Sample
- Journal of Co-operative Organization and Management Sample
- MGT600 Management People and Teams Report 1 Sample
- ECX2953/ECX5953 Economics Essay Sample
- ACC4001 Accounting Principles and Practices Assignment Sample
- LAW6001 Taxation Law Case Study Sample
- TECH1400 Database Design and Management Case Study Sample
- ICT101 Discrete Mathematics Report 3 Sample
- COIT20248 Information Systems Analysis & Design Report 1 Sample
- HCT343 Research Methods and Data Analysis Report Sample
- CAO107 Computer Architecture & Operating Systems Report 2 Sample
- Child Development Case Study Sample
- COU101 Theories of Counselling Essay Sample
- DATA6000 Capstone Industry Case Studies Sample
- TO5103 Global Destination Competitiveness Report Sample
- PUBH1425 Life History and Determinants of Health Report Sample
- OPS928 Logistics Systems Assignment Sample
- ACCY801 Accounting and Financial Management Report 2 Sample
- MBA504 Introduction to Data Analytics for Business Case Study 1 Sample
- 32144 Technology Research Preparations Report 2 Sample
- Social Media Audit Details Report Sample
- DATA6000 Capstone: Industry Case Studies Report Sample
- TECH2100 Introduction to Information Networks Report 3 Sample
- OPS928 Logistics Systems Assignment Sample
- MGT607 Innovation Creativity Entrepreneurship Case Study Sample
- MIS607 Cybersecurity Report 3 Sample
- MBA401 People, Culture and Contemporary Leadership Report 3 Sample
- OB223 Organisational Behaviour Report Sample
- AHS205 The Australian Healthcare System within a Global Context Report 2 Sample
- MBA6301 Event Management Report 3 Sample
- ACF5956 Advanced Financial Accounting Report Sample
- BIZ102 Understanding People and Organisations Report 3 Sample
- MBIS5012 Strategic Information Systems Report Sample
- PRJ5108 Project Delivery and Procurement Case Study 4 Sample
- NURBN2023 Pathophysiology and Pharmacology Applied to Person-Centred Nursing Essay Sample
- TECH2400 Introduction to Cyber Security Report 2 Sample
- NURBN2022 Case Study 3 Sample
- DATA4400 Data-driven Decision Making and Forecasting Report 3 Sample
- MGT502 Business Communication Report 2 Sample
- FIT5057 Project Management Case Study 1 Sample
- TCHR5003 Principles and Practices in Early Childhood Education Assignment Sample
- M20467 Strategic Management Coursework Sample
- PSYC20042 Psychology, Wellbeing, and Resilience Website Blog Report 2 Sample
- MBA504 Introduction to Data Analytics for Business Report 3 Sample
- BUS5003 Information Systems and Data Analysis Case Study 2 Sample
- BSBPMG535 Manage Project Information and Communication Business Documents Diploma Sample
- TECH2400 Introduction to Cyber Security Report 1 Sample
- BUS5VA Visual Analytics Report 3 Sample
- ECE6003 Contemporary Issues, Social Contexts of Learning and Social Justice Sample
- ECUR207 Early Childhood Teacher Report Sample
- ACCM4400 Auditing and Assurance Report Sample
- Personal Improvement Plan Report Sample
- MGT607 Innovation, Creativity & Entrepreneurship Case Study Assignment Sample
- MGT613 Leadership for Sustainable Futures Report Sample
- TECH8000 IT Capstone Report 1 Sample
- BUACC5931 Research and Statistical Methods for Business Assignment Sample
- HS7000 Information Systems in Business Research Report Sample
- Organisational Behaviour (OB) Essay Sample
- GDECE103 Language and Literacy in the Early Years Report 2 Sample
- ICT5151 Data and Information Management Report 4 Sample
- MBA402 Governance, Ethics and Sustainability Report 2 Sample
- MBA633 Real-world Business Analytics and Management Case Study Sample
- PRJ6001 Applied Project Report 1 Sample
- PROJ6000 Principles of Project Management Report Sample
- AT3 Nursing Case Study Sample
- MGT501 Business Environment Report Sample
- DSMG29002 Leadership in Emergency and Disaster Management Report 2 Sample
- MITS6002 Business Analytics Research Report Sample
- MBA633 Real-world Business Analytics and Management Report 2 Sample
- DATA4400 Data-driven Decision Making and Forecasting Report 3 Sample
- MBA504 Introduction to Data Analytics for Business Case Study 2 Sample
- EC400 Agribusiness Economics and Finance Case Study 3 Sample
- TECH2200 IT Project Management Case Study 1 Sample
- MC7080 Digital Marketing & Social Media Report Sample
- HEAL5004 Strategic and Operational Health Services Management Report 3 Sample
- INT102 Assessment 1B Improving Communication with Vision-Impaired People Case Study Sample
- COIT20252 Business Process Management Report 3 Sample
- DATA4000 Introduction to Business Analytics Case Study 1 Sample
- BUS2003 Data Engineering & Python Report 1 Sample
- ECON20039 Economics for Managers Report 2 Sample
- FIN600 Financial Management Case Study Sample
- BULAW5915 Corporate Law Assignment Sample
- MANM399 International Accounting and Finance Project Report Sample
- MBIS5010 Professional Practice in Information Systems Essay 2 Sample
- MBA6204 Quantitative Support of Decision Making Report 2 Sample
- BSBOPS601 Develop and Implement Business Plan Diploma Sample
- MGT602 Business Decision Analytics Report Sample
- CMT218 Data Visualisation Case Study Sample
- BUS101 Business Communication Essay 3 Sample
- MIS602 Data Modelling and Database Design Report 1 Sample
- PPMP20008 Initiating and Planning Projects Report 3 Part B Sample
- MBA642 Project Initiation, Planning and Execution Report Sample
- MIS603 Microservices Architecture Report 3 Sample
- MCR001 Economics Case Study Sample
- MIS604 Requirement Engineering Report 3 Sample
- BE489 Analysing Organizations in the International Report Sample
- FINM4100 Analytics in Accounting, Finance and Economics Report 2 Sample
- Recovery Nursing Care Plan Case Study Sample
- MLC707 Business Law Assignment Sample
- MIS603 Microservices Architecture Case Study Sample
- PROJ-6012 Managing Information Systems, Technology Report Sample
- MBA6204 Managing the Quantitative Support of Decision Making Report 2 Sample
- ENEG11005 Introduction to Contemporary Engineering Report Sample
- CAP203 Care of The Person With An Acute Illness Report 4 Sample
- MBIS4008 Business Process Management Report 2A Sample
- CS4417 Software Security Report Sample
- BUS2008 Strategic Planning Report Sample
- MITS4004 IT Networking and Communication Report Sample
- STAT2009 Statistics for Managerial Decision Assignment Sample
- BUS5PB Principles of Business Analytics Report 1 Sample
- BUS102 Management Principles Essay 2 Sample
- BIS3006 IS Capstone Industry Project B Report Sample
- Marketing Assignment Writing Sample
- DHI401 Digital Health and Informatics Report 2 Sample
- BST714 Strategic and Operational Decision-Making Assignment Sample
- EDU30059 Teaching Technologies Report 2 Sample
- MBA404 Consumer Behaviour and Marketing Psychology Report 1 Sample
- CCS103A Counselling and Communication Skills Report Sample
- TECH5300 Bitcoin Report 2 Sample
- MBA5004 Managing Decision Making Process Report 2 Sample
- MN7001 Summative Assessment 2 Report Sample
- Strategic and Operating Health Management Report 2 Sample
- EC102 Agricultural Economics Assignment Sample
- MBA404 Consumer Behaviour and Marketing Psychology Case Study 2 Sample
- CA7013 Sustatnability in Global Companies 2022-23 Report
- Local Government Area LGA Essay 2 Sample
- EDU20014 Social and Emotional Learning Report Sample
- BE485 Management and Strategy Report Sample
- NURBN3030 Management of Deteriorating Patient Report Sample
- MBIS4008 Business Process Management Report Sample
- GDECE102 Learning and Development Birth To Two Years Report 1 Sample
- HCCSSD102 Person Centred Practice Report 1 Sample
- MBA6104 Business Process Modelling & Management Report Sample
- NUR2023 Pathophysiology, Pharmacology, and Nursing Management Case Study 2 Sample
- Information Security Assignment Sample
- BAO6504 Accounting For Management Report Sample
- DATA4700 Digital Marketing and Competitive Advantage Report 3 Sample
- MGNT803 Organisational Behaviuor and Management Report Sample
- MBA6001 Investment Management Report 2 Sample
- HCCSSD104 Lifespan Development Report 3 Sample
- MBA401 People, Culture and Contemporary Leadership Report Sample
- MG301 Agriculture and Resource Policy Case Study Sample
- MBA505 Business Psychology Coaching and Mentoring Report Sample
- CWB103 Interpersonal and Intercultural Negotiation Assessment 1 Sample
- MEM601 Engineering Sustainability Report Sample
- MCR006 Financial Management Assignment 3 Sample
- TECH8000 IT Capstone Report Sample
- MOB6110 Creating Entrepreneurial Leaders Report Sample
- EDU20014 Social and Emotional Learning Report Sample
- CHM108 Introduction to Business Law Report 1 Sample
- MBA404 Consumer Behaviour and Marketing Psychology Report 3 Sample
- MITS4001 Business Information Systems Case Study 3 Sample
- COIT20253 Business Intelligence using Big Data Report Sample
- OPS928 Logistics Systems Report 2 Sample
- MIS608 Agile Project Management Report 2 Sample
- DATA4600 Business Analytics Project Management Case Study 1 Sample
- MBA622 Comprehensive Healthcare Strategies Report 1 Sample
- MITS5003 Wireless Networks and Communication Case Study Sample
- Finance Mini Case Study Sample
- OPS909 Total Quality Management Report Sample
- NURBN2021 Nursing Essay Sample
- MIS605 Systems Analysis and Design Report 2 Sample
- BM303 Contemporary Issues in Agribusiness Production and Management Case Study Sample
- HWEL2006 Social and Emotional Wellbeing Case Study 3 Sample
- Clinical Governance Essay 1 Sample
- MBA503 Operations Management and Decision-Making Models Report 3 Sample
- ES5702 Planetary Health and Climate Change Report Sample
- MBA404 Consumer Behaviour and Marketing Psychology Report Sample
- Investigating The Issue of Inequality in Workplaces Essay Sample
- MKTG6002 Marketing Report 3 Sample
- COIT20253 Business Intelligence using Big Data Report 1 Sample
- OPS909 Total Quality Management Report 1 Sample
- OPS802 Operations Management of Subway Research Report 4 Sample
- MBA402 Governance, Ethics and Sustainability Report 3 Sample
- MIS610 Advanced Professional Practice Report 2 Sample
- TECH2200 IT Project Management Case Study Sample
- MIS609 Data Management and Analytics Case Study 3 Sample
- MBA600 Capstone Strategy Essay 3 Sample
- MBA600 Capstone Strategy Essay 3 Sample
- INFS5023 Information Systems for Business Case Study Sample
- MBA643 Project Initiation, Planning and Execution Report Sample
- BULAW5916 Taxation Law and Practice Assignment Sample
- MEM603 Engineering Strategy Report 2 Sample
- MITS5004 IT Security Research Report 2 Sample
- BLCN29001 Construction Technology Report Sample
- ACC202 Contemporary Financial Accounting Report Sample
- GAL613 Grief and Loss Essay Sample
- BIZZ201 Accounting for Decision Making Report Sample
- MBA613 Organisational Change and Innovation Case Study 3 Sample
- Business Management Report Sample
- MBA6302 Integrated Marketing Communications Report Sample
- TECH3200 Artificial Intelligence and Machine Learning in IT Report 3 Sample
- BUMKT5902 Marketing Mix Strategy Report Sample
- Impact of Green Supply Chain Management on The Profitability of The Retail Industry Sample
- NURBN3031 Teaching, Learning and Situational Leadership for Health Practice Sample
- MGT502 Business Communication Report 1A Sample
- BPM Final Assignment Sample
- PUBH6008 Capstone A Applied Research Project in Public Health Report Sample
- HI6034 Enterprise Information Systems Report Sample
- Principles of Supply Chain Management Report Sample
- TECH2100 Introduction to Information Networks Report 2 Sample
- INT103 Human Development Across the Lifespan Report 2 Sample
- ACC602 Financial Accounting and Reporting Report 4 Sample
- MBA623 Healthcare Management PPT Sample
- FIN311 Agricultural Accounting and Business Law Part A Report Sample
- OMGT2327 Distribution and Freight Logistics Case Study 1 Sample
- MBA602 Small Business Administration Case Study 2 Sample

 81 Isla Avenue Glenroy, Mel, VIC, 3046 AU


