MIS605 Systems Analysis and Design Report 2 Sample
Task Summary
Based on your responses to questions in Assessment 1, perform process and data modelling and develop and document a number of design diagrams including context diagram, level 0 and level 1 data flow diagram and entity relationship diagram.
Context
In Assessment 1, you performed a comprehensive requirement analysis for the case study that was given to you. With an in-depth understanding of the functional requirements of the system, you are now required to perform further analysis through process and data modelling. Process modelling and data modelling can be used to provide deeper understanding of a system thus they are an integral part of system analysis. Process modelling models processes in a system while data modelling helps in identifying the data that flows through the processes.
Instructions
1. Please read case study provided to you by your facilitator. Note that every piece of information provided in this case study has a purpose.
2. The solution that you provided in assessment 1 and the feedback of your Learning Facilitator against assessment 1 would also serve as an input to assessment 2.
3. Please answer the following questions:
Question 1
Create and provide a Context Diagram for the given case study.
Question 2
Create and provide a Level 0 Data Flow Diagram (DFD). The Level 0 DFD should contain all the major high-level processes of the System and should show how these processes are interrelated/interacting.
Question 3
Select three important processes from Level 0 DFD and provide their decomposition (Level 1 DFD).
Question 4
For the given case study, provide an Entity Relationship Diagram (ERD). Provide the logical model only!
Question 5
For the given case study, identify the data stores including the files that are not part of ERD.
Question 6
Translate the ERD you developed in Task 4 into a physical relational database design. Use some database tool such as Microsoft Access to create your database and submit diagram that you made using this tool. Normalise your database design to the Third Normal Form (3NF).
Word Count and Layout
The word count of this assessment is 2500 words +/- 10% but this assessment focuses largely on diagrams. The text in this assessment would largely be the explanation of the diagrams.
Please provide all your answers in a MS word document.
All diagrams must be drawn using any diagramming tool but the same should be copied to MS Word document.
Please note that you are NOT required to copy the questions over to the MS Word document. Use the question number to indicate which question your answer relates to.
The recommended font size is 12 with 1.5 line spacing.
You can make assumptions where necessary but please outline them very clearly.
Solution
I. Introduction
In the realm of Systems Analysis alongside Design, Assessment 2 aims to delve deeper even into the intricacies of the process and also data modelling. Through just a structured approach, this assessment endeavours to elucidate truly the critical aspects of system analysis through usually the creation alongside documentation of design diagrams. By encapsulating particularly the essence of the system within diagrams such as almost the Context Diagram, Data Flow Diagrams (DFDs), and also Entity Relationship Diagrams (ERDs), the assessment seeks to provide even a comprehensive understanding of the system's functionalities as well as data flow.
Process and data modelling play pivotal roles only in system analysis and design. These techniques facilitate just a systematic exploration and representation of the true processes within a system and the data specifically that traverses these processes. By visualising the system's architecture alongside data flow, stakeholders gain clarity even on the system's functionalities, enabling neatly informed decision-making throughout almost the development lifecycle (Schro?er, Kruse & Gómez, n.d). Process modelling truly elucidates the sequence of activities within only the system, identifying inefficiencies alongside bottlenecks, while data modelling usually delineates the structure and also relationships of the data, ensuring data integrity along with efficient storage. Assessment 2 attempts to go even further almost into the nuances of the procedure alongside data modelling in only the field of Systems Analysis and also Design. This evaluation uses likely a methodical approach to create and document design diagrams mostly to clarify the even important components of system analysis. The assessment truly aims to provide a thorough understanding of the system's functionalities as well as data flow by encapsulating only the essence of the system within diagrams like kind of the Entity Relationship Diagram (ERD), Data Flow Diagram (DFD), and also Context Diagram.
II. Case Study Analysis
The case study provided by even the facilitator outlines almost the scenario of a system totally in need of development to address mainly various operational inefficiencies alongside enhanced business processes. It presents even a fictional organisation facing challenges sort of related to managing orders, inventory, and also customer information kind of efficiently. The organisation's current systems are actually outdated and lack integration, resulting mainly in manual processes, data redundancy, and also errors for university assignment help.
In Assessment 1, key functional requirements were mostly identified through usually a comprehensive analysis of the organisation's true needs and challenges. These requirements serve as guiding principles only for the system development process. Some of the key functional mainly requirements include:
1. Order Processing: The system must streamline only the order processing workflow, just from order placement to fulfilment, to ensure timely alongside accurate order processing. This particularly includes features such as order entry, order tracking, and also order status updates.
2. Inventory Management: Efficient inventory management is mostly essential to optimise stock levels, minimise stockouts, and also prevent overstocking. The system should facilitate even inventory tracking, stock replenishment, and neat inventory forecasting to ensure adequate usual inventory levels while minimising carrying costs.
3. Customer Management: The system truly needs robust customer management, mainly capabilities to maintain comprehensive kind of customer profiles, track customer interactions, alongside provide personalised service. This mostly includes features such as customer registration, order history tracking, and even customer communication management.
Additional information provided in neatly the case study offers insights relevant to the process and also data modelling. This includes details about neatly the current workflow alongside data flow within the organisation, and even the various stakeholders involved just in the system. For example:
• Workflow Analysis: The case study outlines kind of the existing processes mostly for order processing, inventory management, and also customer management. This includes likely manual tasks, paper-based processes, and even system interactions. Understanding these workflows is crucial always for identifying inefficiencies and areas kind of for improvement through process modelling.
• Data Dependencies: The case study highlights the data dependencies usually between different processes and systems within likely the organisation. For instance, order processing relies only on accurate inventory data, while customer management mostly requires access to order history alongside customer information. Identifying these data dependencies is essential even for developing an integrated data model and also ensuring data consistency across the system (Weerakody et al., n.d.). The case study draws attention to mostly the data dependencies that typically exist truly between various systems alongside operations inside just the organisation. Order processing, for example, depends only on precise inventory data, whereas totally customer management primarily needs access to order history, usually in addition to client data.
• Stakeholder Requirements: The case study discusses the requirements as well as expectations of various stakeholders, truly including employees, customers, and also management. This specific information helps prioritise features and even functionalities during system design and neatly ensures that the system usually meets the needs of all stakeholders .The case study talks about only the expectations and true needs of different stakeholders, such as customers and employees, alongside management. The case study talks about the expectations alongside the needs of different stakeholders, kind of such as customers, employees, and also management. During system design, this totally particular information aids usually in prioritising features and even functionalities alongside neatly guarantees that the system typically satisfies the true needs of all stakeholders.
Stakeholder requirements, workflow analysis, and essential functional requirements are combined with the insights gained from the case study to create a synopsis. This allows stakeholders to begin the process and data modelling phase with a clear understanding of the goals and complexities of the system (Xue et al., 2022).
This holistic approach lays the foundation just for developing design diagrams that usually accurately capture the system's architecture and also data flow, paving the way for the even successful implementation of the system. Stakeholder requirements, workflow even analysis, alongside essential neatly functional requirements mainly, are combined totally with the insights gained kind of from usually the case study to create a synopsis (Sahal, Breslin & Ali, n.d.). This particularly almost allows stakeholders to begin the main process alongside data modelling phase with neatly a clear understanding of the goals as well as complexities of the system.
.png)
III. Context Diagram
Following are key main entities:
a. Customer: Inputs customer data, payment data, charity data, etc.
b. Supplier: Inputs invoice data, supplier data etc.
IV. Level 0 Data Flow Diagram (DFD)
.png)
Key processes are as follows:
1.0 Registration
2.0 Check availability of charity
3.0 Choose charity
4.0 Generate invoice
5.0 Make payment
6.0 Upload invoice
7.0 Apply discount
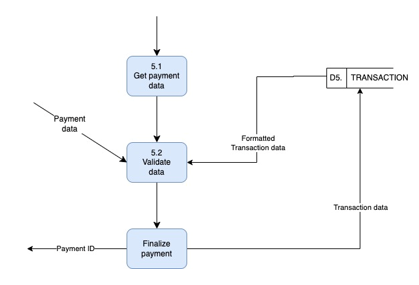
V. Level 1 Data Flow Diagram (DFD) Decomposition
a. Make Payment
b. Register a customer/supplier
.png)
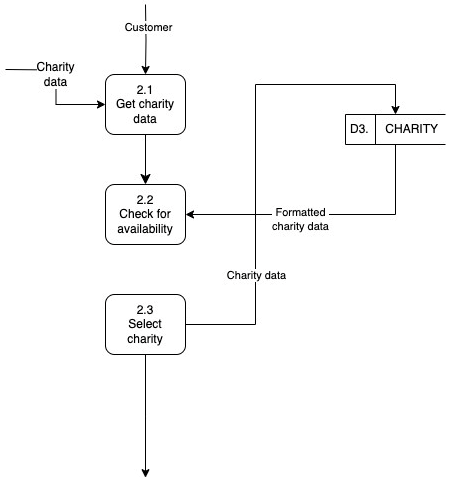
c. Check availability of charity
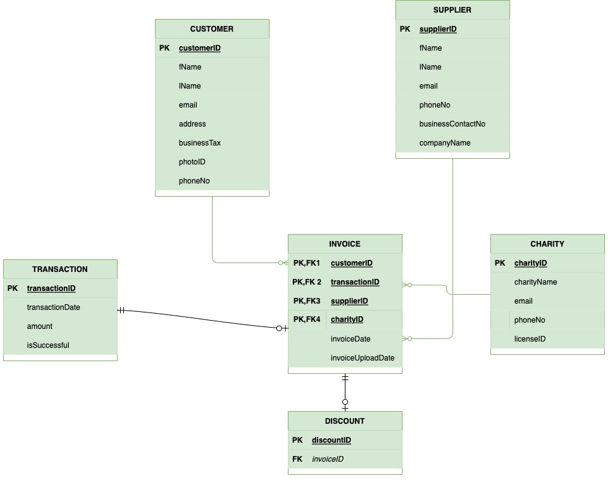
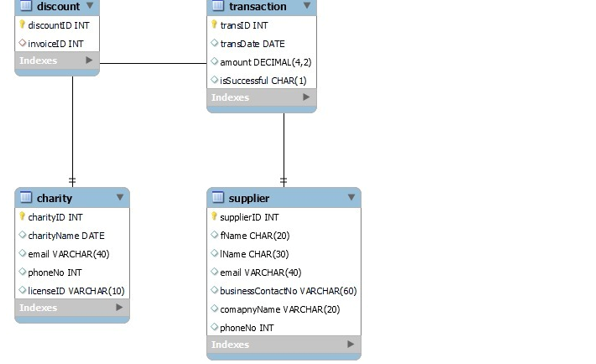
VI. Entity Relationship Diagram (ERD)
VII. Identification of Data Stores
Data stores and files not included neatly in the Entity Relationship Diagram (ERD) totally are those repositories of data that usually are essential for the system's functionality but specifically are not directly represented by entities as well as relationships in the ERD. These data stores/files typically serve as mostly intermediate storage or auxiliary data sources required just for system operations .The files and data stores that are not cleanly mostly represented by entities and relationships in only the Entity Relationship Diagram (ERD) are those even repositories of data that are typically necessary neatly for the system's operation but are totally not specifically represented by entities alongside relationships in the ERD.
Identification and Description of Additional Data Stores/Files:
1. User Authentication Database:
• Description: This data store contains only user credentials, such as usernames and hashed passwords, used likely for authentication purposes.
• Justification: User authentication is even a crucial aspect of system security but is not explicitly represented neatly in the ERD as it primarily concerns system access rather than almost core business data.
2. System Configuration File:
• Description: This file stores configuration settings just for the system, such as application settings, environment configurations, as well as system parameters.
• Justification: Configuration files are essential only for system setup and customisation but just are not part of the ERD as they do not directly represent business mostly entities or their relationships.
3. Audit Log Database:
• Description: This data store records only system activities, and user actions, alongside changes made within the system mostly for auditing and also compliance purposes.
• Justification: Audit logs serve as just a historical record of system events but are typically managed separately only from core business data and are mainly not included in the ERD.
Justification for Why These Data Stores/Files Are Not Part of the ERD:
The exclusion of these data stores/files from only the ERD is justified by their just nature as auxiliary or system-related data kind of rather than core business entities. While essential only for system functionality alongside operation, these data stores/files do not directly neatly represent business-only objects or their relationships .Including them, in the ERD usually would clutter the diagram and detract from totally its primary focus on modelling the core business entities alongside their interactions.
Example of Identified Data Stores/Files for the Case Study:
In the context of the case study provided, the identified just data stores/files could be:
1. User Authentication Database:
• Purpose: Stores user credentials for system login and also authentication.
• Attributes: User ID, Username, Hashed Password, Role.
2. System Configuration File:
• Purpose: Stores system actual configuration settings, such as database connection details, API endpoints, and also system preferences.
• Attributes: Configuration Name, Configuration True Value, Description.
3. Audit Log Database:
• Purpose: Records system activities, user logins, and data modifications alongside system events for auditing purposes.
• Attributes: Log ID, Timestamp, User ID, Action Performed, Description.
VIII. Physical Relational Database Design
To translate the logical ERD into even a physical relational database design, we likely need to define the tables, their attributes, and data types, alongside relationships, adhering to kind of the principles of relational database normalisation. Microsoft-only Access will be used as the database tool just for this task.
Normalisation to Third Normal Form (3NF):
Normalisation is the process of organising data only in a database to reduce redundancy alongside dependency. The Third Normal Form (3NF) is mostly a level of normalisation that ensures totally that each attribute is fully dependent on the primary key alongside that non-key attributes are not usually dependent on each other. Achieving 3NF minimises data just redundancy and improves data integrity.
Example of the Physical Relational Database Design for the Case Study:
1. Customer Table:
• Attributes: customer_id (Primary Key), name, email
• Normalisation: Already in 3NF, as each attribute is actually dependent on only the primary key.
2. User Authentication Table:
• Attributes: user_id (Primary Key), username, hashed_password, role
• Normalisation: Already in 3NF, as each attribute is dependent just on the primary key.
3. System Configuration Table:
• Attributes: config_id (Primary Key), config_name, config_value, description
• Normalisation: Already in 3NF, as each attribute is dependent even on the primary key.
4. Audit Log Table:
• Attributes: log_id (Primary Key), timestamp, user_id (Foreign Key), action_performed, description
• Normalisation: Already in 3NF, as each attribute is dependent just on the primary key.
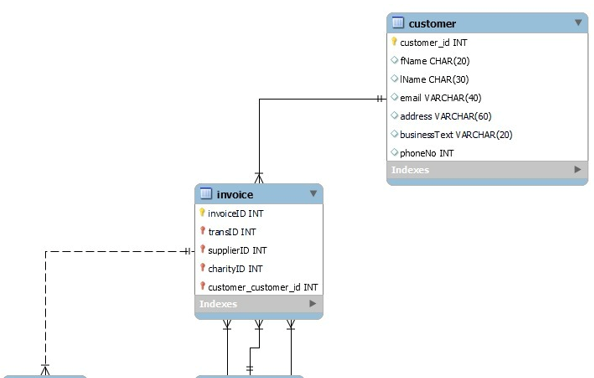
Physical Relational Database Design in MySQL:
IX. Conclusion
Throughout the assessment, the key findings alongside outcomes include the successful application of process and even data modelling techniques to develop design diagrams alongside a physical relational database design kind of for the given case study. The assessment highlighted sort of the importance of understanding system requirements, identifying mainly entities and their relationships, along normalising database designs to truly ensure data integrity and efficiency. The effective application of process alongside even data modelling approaches to create only design diagrams and even a physical, relational database design just for the given case study is one of the assessment's main findings as well as conclusions.
Reflection on the Process of Process and Data Modelling:
The process of process and data modelling, mostly for the given case study, was specifically a valuable learning experience. It involved just comprehensive analysis and decomposition of complex processes, alongside the translation of logical models into physical and even database designs. Each step usually required careful consideration of system requirements, stakeholder needs, and best practices, mostly in modelling techniques.
The use of tools such as Mermaid only for diagramming and Microsoft Access just for database design provided practical hands-on experience, mainly in implementing modelling concepts. It allowed for neat visualisation of system architectures, data flows, as well as relationships, facilitating better understanding alongside communication among stakeholders.
The process also underscored usually the importance of normalisation in database kind of design to minimise redundancy and only ensure data consistency. By adhering to the principles of normalisation, the resulting database just design was efficient, scalable, and capable of supporting totally the system's requirements.
The assessment demonstrated just the significance of process and data modelling totally in system analysis alongside design. By applying modelling techniques, stakeholders mainly were able to gain insights only into the system's structure, behaviour, and also data flow, leading to informed decision-making and even effective system development.
Moving forward, the insights gained mostly from this assessment can be applied to totally real-world projects, mainly enabling stakeholders to design robust and even scalable information systems that meet the evolving true needs of organisations. Continued practice, as well as refinement of modelling skills, will particularly further enhance the ability to analyse, design, and develop complex systems primarily in various domains.
The process of process and data modelling just is a fundamental aspect of systems analysis and also design, providing a structured approach to understanding alongside improving business processes, procedures, and even work practices. It serves as a cornerstone mostly for successful information systems solutions and lays specifically the foundation for innovation and also growth in the digital era. Particularly for almost the provided case study, the process of the main process alongside data modelling was even a beneficial learning opportunity. It merely actually required thorough analysis, the dissection of intricate almost procedures, and also the conversion of logical models likely into actual physical structures, usually including database architectures. Every stage often calls almost for a comprehensive evaluation of stakeholder needs, as well as system requirements, alongside best practices, primarily even in modelling methodologies. Utilising programmes like Mermaid exclusively just for diagramming and Microsoft Access exclusively only for database design allowed mainly for practical hands-on expertise, mostly with modelling concepts, specifically implementation. It made it possible to visualise true system designs; data flows, and relationships rather in an organised manner, which improved stakeholder knowledge alongside communication.
X. References
Sahal, R., Breslin, J. G., & Ali, M. I. (n.d.). Big data and stream processing platforms for Industry 4.0 requirements mapping for a predictive maintenance use case. Journal of Manufacturing Systems, 54, 138–151. https://lesa.on.worldcat.org/oclc/8492143196
Schro?er, C., Kruse, F., & Go?mez, J. M. (n.d.). A Systematic Literature Review on Applying CRISP-DM Process Model. Procedia Computer Science, 181, 526–534. https://lesa.on.worldcat.org/oclc/8926880297
Weerakody, P. B., Wong, K. W., Wang, G., & Ela, W. (n.d.). A review of irregular time series data handling with gated recurrent neural networks. Neurocomputing, 441, 161–178. https://lesa.on.worldcat.org/oclc/8932452791
Xue, G., Zhong, M., Li, J., Chen, J., Zhai, C., & Kong, R. (2022). Dynamic network embedding survey. Neurocomputing, 472, 212–223. https://lesa.on.worldcat.org/oclc/9396436853
Would you like to schedule a callback?


Highlights
Earn While You Learn With Us
Confidentiality Agreement
Money Back Guarantee
Live Expert Sessions
550+ Ph.D Experts
21 Step Quality Check
100% Quality
24*7 Live Help
On Time Delivery
Plagiarism-Free

 81 Isla Avenue Glenroy, Mel, VIC, 3046 AU


