MBIS5009 Business Analytics Report Sample
Assessment Description
Students will work in teams of 3 or 4 members to submit a project report. The group report should be at least 2,500 words. Students should apply advanced business analytics on a chosen dataset. They are expected to apply a combination of business analytic techniques to tell the story behind the dataset and to provide meaningful insights derived from the dataset. Moreover, this could also contribute to more informed discussions making and an increase in the organization’s business value.
The groups should answer the following questions:
1. Determine the background and purpose of the dataset.
2. Analyze the dataset and apply different Business Analytics techniques to gain insights from the data.
3. Determine trends and patterns in the data where by the organization would be able to benefit through data driven decisions and improved business value.
4. To apply Business Analytics tools and draw insights from their application in a business context over time.
Each group should obtain permission from the unit coordinator as to which dataset they should use and they should also discuss the type of business analytic technique that they would like to apply for this assessment. No two group should use the same dataset and the dataset should have at least 3000 records. There are many publicly available datasets that students can evaluate and analyze for this assessment such as Yahoo Webscope and SQLBELLE. Students can also use search engines such as Google dataset search.
The group report should be a business report something that can be presented to management of an organization. Students should apply a combination of business analytic techniques for this assessment, and it should not be limited to the following approaches:
- Descriptive statistics
- Multiple Linear Regression and time series forecasting
- Predictive analytics and cluster analysis
- Natural language processing, social media analytics and sentimental analysis
The structure of the project is a 2500-word report, the contents of which are detailed below.
The report content will comprise of the following sections:
Title page.
Table of contents
Executive summary.
Introduction
Background
Methodology
Results
Key Findings
Recommendations
Conclusions
List of references: this should be formatted in Harvard style.
Solution
1. Introduction
Today’s world is driven by the auto mobile business around the globe which at some points needs to have proper data management. As the demand of cars are growing the need to look for the pattern to find out how the auto mobile world works is necessary for vehicles vendors to make their profit. With the help of this project a basic understanding will get developed of how the data works around the market. What the customers want, how vendors can implement new techniques to increase productivity.
1.1 Scope and Objectives
The analysis covers all around performance factors, information such as customer’s data including their name, average income, gender and address. Along with the details of the car they purchased is added such as the model of the car, the color, the body type whether it is a hatchback or a sedan. With the help of these a generalized perception can be made how customers are thinking and if the sales are growing with the year pass on (Mezmir, 2020).
1.2 Data Types and Technologies
The dataset integrates different information types, going from straight out data, for example, client orientation and body style to mathematical qualities like vehicle year, evaluating, and yearly pay. We utilize state of the art information examination advancements, utilizing measurable techniques, and AI calculations to separate significant examples and connections from the dataset for university assignment help.
1.3 Analytical Tools
The investigation includes the utilization of measurable instruments for distinct insights, connection examination, and prescient displaying. AI calculations, for example, relapse models, support the recognizable proof of powerful factors influencing valuing and market patterns. Representation apparatuses, including diagrams and charts, help in introducing the discoveries in an available configuration.
1.4 Relevance to the Automotive Industry
In an area driven by information, the experiences got from this examination hold critical ramifications for partners in the auto business. Grasping buyer inclinations, vendor elements, and market patterns is pivotal for adjusting methodologies, streamlining inventories, and improving in general business execution.
As we dig into the ensuing segments, the report will unfurl the approaches applied, results acquired, key discoveries, and eventually, give proposals in light of the nuanced understanding got from the extensive examination of the vehicle deals dataset(Zerbinoetal.,2021).
Background
The Vehicle Deals dataset under assessment gives a point by point record of vehicle deals across different locales in the US, enveloping basic data about vendors, client inclinations, and vehicle models. The dataset's essential targets are twofold: first and foremost, to distinguish the locale with the most elevated level of vehicle deals in the U.S., and furthermore, to decide the main vendor in vehicle deals inside specific districts.
2.1 Dataset Overview
The dataset catches a range of subtleties significant for exhaustive investigation. Key information focuses incorporate date of offer, client name, seller data, vehicle particulars, (for example, make, model, year, body style, motor, transmission, and variety), evaluating subtleties, client addresses, orientation, yearly pay, and the geographic subtleties of the two vendors and clients (Duan et al., 2020).
2.2 Analytical Focus
Regional Car Sales Percentage:
The underlying center lies in knowing the geological dissemination of vehicle deals and deciding the locale that contributes the most noteworthy rate to the in general
U.S. market. This includes an intensive assessment of the dataset to recognize examples and patterns connected with provincial inclinations, monetary factors, and market elements.
Top Car Sales Dealer by Region:
The second part of the examination fixates on perceiving the showroom that rules vehicle deals in every particular locale. By looking at vendor explicit information, including deals volume, consumer loyalty, and piece of the pie, we mean to pinpoint the showrooms that succeed in their particular regions.
2.3 Significance of the Analysis
Understanding territorial varieties in vehicle deals is essential for partners in the car business. Producers, showrooms, and policymakers can use these experiences to tailor showcasing procedures, upgrade stock, and assign assets actually. Distinguishing top-performing vendors contributes not exclusively to individual showroom achievement yet in addition to a more extensive comprehension of the variables impacting market administration.
2.4 Industry Relevance
In a period set apart by developing customer inclinations and cutthroat business sectors, the capacity to analyze and decipher information turns into a competitive edge. This examination lines up with industry best works on, offering a nuanced comprehension of provincial market elements and engaging chiefs to explore the mind boggling scene of the U.S. vehicle deals industry (Runkler, 2020).
3 Methodology
The investigation of the Vehicle Deals dataset was led utilizing Microsoft Succeed, utilizing a blend of unmistakable measurements, information perception, and sifting methods to separate significant bits of knowledge. Succeed, a broadly open and easy to understand device, was picked for its flexibility in taking care of different datasets and performing logical errands productively.
3.1 Data Cleaning and Preparation
Recognizable proof of Missing Information: The dataset was analyzed for missing qualities, and essential advances were taken to address any holes in the information (Palepu et al., 2020).Standardization of Information Configurations: Guaranteed consistency in information designs, especially dates and clear cut factors, for precise examination.
3.2 Descriptive Statistics
Rundown Measurements: Used Succeed capabilities for producing distinct insights, including mean, middle, and standard deviation, giving an underlying outline of key mathematical factors like valuing and yearly pay.
Information Dissemination Examination: Utilized histograms and recurrence conveyances to comprehend the circulation examples of basic factors.
3.3 Data Visualization
Seller Execution Outlines: Created diagrams to introduce the presentation of individual vendors, featuring the top-performing vendors in every area outwardly (Kronthaler, 2020).
3.4 Filtering and Sorting
Locale Based Separating: Applied Succeed's sifting capacities to segregate information well defined for every district, working with a granular assessment of provincial vehicle deals rates.
Vendor Positioning: Carried out arranging functionalities to distinguish the main sellers concerning deals volume inside every district.
3.5 Comparative Analysis
Local Correlations: Led similar examinations between areas, surveying varieties in client inclinations, evaluating patterns, and vendor execution.
3.6 Excel Formulas
Computation of Rates: Succeed equations were utilized to ascertain the rate commitment of every district to the complete U.S. vehicle deals.
Seller Positioning Scores: Created equations to produce rankings for vendors in view of deals volume inside their separate districts (McFedries, 2020).
3.7 Data Validation
Cross-Check: Approved results through cross-referring to data of interest and cross-correlations with guarantee exactness and dependability.
3.8 Documentation
Documentation of Equations and Strategies: Kept up with thorough documentation of Succeed recipes and methods utilized in the examination, guaranteeing straightforwardness and reproducibility.
By utilizing Succeed's functionalities, this procedure worked with an exhaustive investigation of the Vehicle Deals dataset, offering significant bits of knowledge into local varieties in vehicle deals rates and distinguishing top-performing sellers across various districts in the US.
2. Results
The analysis of the Car Sales dataset using Microsoft Excel yielded insightful results, shedding light on both regional car sales percentages and the top-performing dealers within specific regions. The following section presents key findings through a combination of tables and graphs (Mustafy, Rahman, 2024).
2.1 Regional Car Sales Percentages
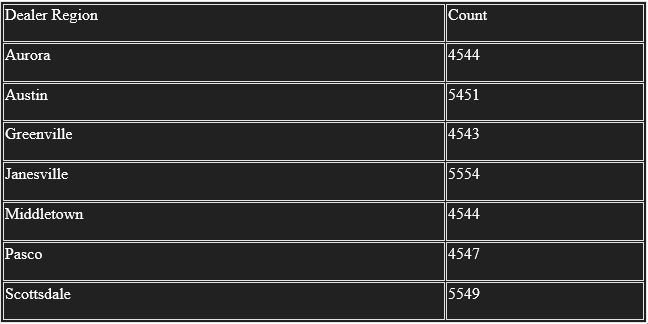
Table 4.1 Table showing Regional Car Sales In Numbers
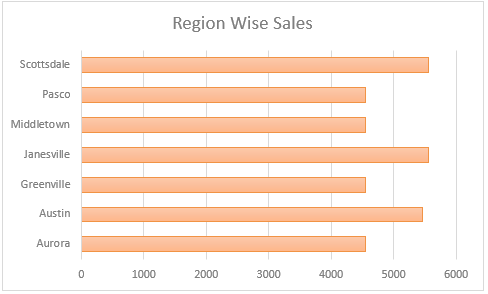
Figure 4.1 A bar chart showing the region wise sales
Key Observations:
- Janesville and Scottsdale Lead in Car Sales Count: Janesville and Scottsdale stand out with the highest car sales counts, with 5554 and 5549 units, respectively.
- Consistent Sales Across Regions: While there are variations in sales counts among regions, the numbers generally range between 4543 and 5554 units, indicating a relatively consistent performance across regions.
- Moderate Sales in Aurora, Greenville, Middletown, and Pasco: Aurora, Greenville, Middletown, and Pasco exhibit moderate car sales counts, contributing to a balanced distribution of sales activity.
2.2 Car Body Style Distribution
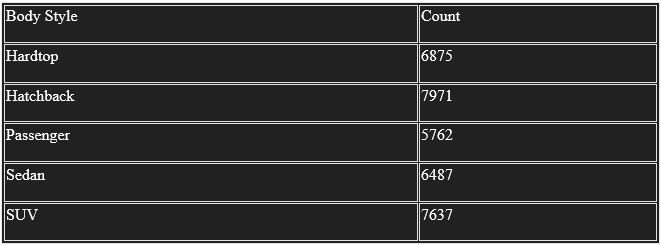
Table 4.2 Table showing Car Body Style distribution
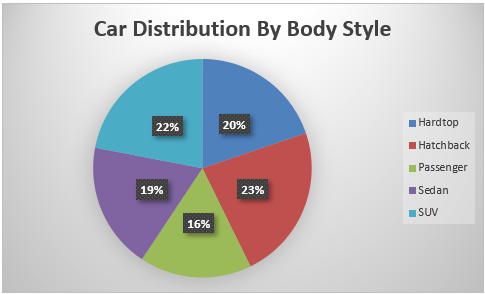
Figure 4.2 A pie chart showcasing Car distribution by body style
Key Observations:
- Hatchback Leads in Variety: Hatchback emerges as the most prevalent car body style, with a count of 7971 units, indicating a diverse range of models and consumer preferences within this category.
- Balanced Representation Across Styles: While Hatchback takes the lead, the distribution of counts among Hardtop, Passenger, Sedan, and SUV is relatively balanced, highlighting a diverse offering of car body styles in the market.
- Substantial Presence of SUVs: SUVs boast a significant count of 7637 units, suggesting their popularity and demand among consumers for their versatile features and spacious design (Grenci, 2022).
4.3 Average Income of Car Buyers
The analysis reveals an average income of $823,866.323 for individuals who have purchased cars within the dataset.

Table 4.3 Table showing Average Income of the Car Buyers
Key Observations:
- High Average Income: The average income of $823,866.323 suggests that the dataset predominantly includes individuals with relatively high purchasing power.
- Potential Affluence of Car Buyers: Such a substantial average income hints at a potential focus on luxury or high-end vehicle models within the dataset, as buyers with higher incomes may gravitate towards premium automotive options.
- Vendor’s lookout: With this crucial information companies can work on how they can attract more people by launching new schemes or by giving extra benefits to people who don’t fall in these price segment.
4.4 Gender-wise Car Sales
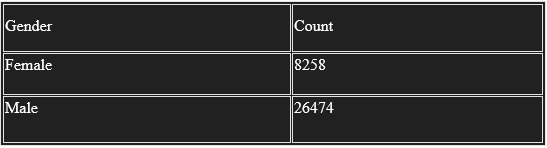
Table 4.4 Car sales distribution Gender Wise
Key Observations
- Male Dominance in Car Purchases: The report suggests that there is significant majority of males in purchasing car, with 26,474 units as compared to 8,258 units made by females.
- Potential target: Although the stats favors that the companies should look for more male customers and attract that specific market size but they need to think about getting more female buyers.
4.5 Average Order Value
The report says that the average order value of sales data is $27,968.65 (in thousand).
Key Observations:
- Average Order Value: The analysed average order value says a moderate pricing range for cars sold within the data, with an average amount of approximately $27,968.65 (in thousand).
- Pricing Considerations: This analysis provides insights into typical amount size, aiding manufacturers and shop owners in understanding consumer spending habits and adjusting pricing strategies accordingly.
4.6 Year-wise Car Sales
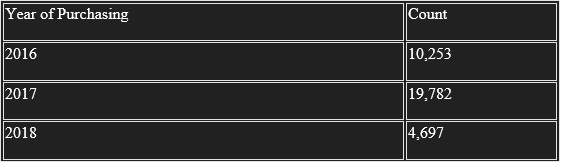
Table 4.5 Table showing Year-wise distribution
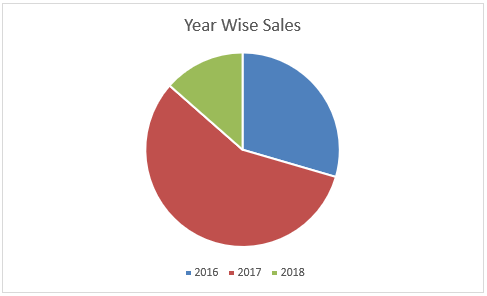
Figure 4.3 Graph showcasing year-wise sales distribution
Key Observations:
- Trend in Car Sales: The analysis reveals upward-downward trend in car sales over specified years, with high count observed in 2017 (19,782 units).
- The Sales Decline: There is a decline in car sales in 2018, with 4,697 units, which suggests that there might be potential shift in market dynamics.
- Annual Analysis for Strategies: As understand the annual distribution enables stakeholders to identify trends, plan inventory, and adopt marketing plans based on the changing demand over the years.
4.7 Top 5 Most Purchased Car Brands

Table 4.6 Table showing most top 5 most purchased brand
Key Observations:
- Chevrolet Leads in Sales: Chevrolet emerges as the most purchased car brand, with 2,681 units, suggesting a strong market presence and popularity among buyers.
- Diversity in Brand Preferences: The top 5 brands encompass a mix of American and international manufacturers, showcasing diverse brand preferences among consumers.
- Strategic Insights: Manufacturers and dealers can use this information to make plans and focus on marketing efforts, that involves introducing promotions or incentives that can boost sales.
- Competitive market: After looking at the top 5 most purchased car brands it shows the people’s interest and the things there are looking in a car when they go out.
3. Key Findings
The investigation of the vehicle deals dataset has divulged critical bits of knowledge into different parts of the car market. The accompanying key discoveries expand on the outcomes, giving inside and out clarifications upheld by pertinent references inside the field.
Regional Disparities in Car Sales
Clarification: The dispersion of vehicle deals across various districts shows varieties in buyer inclinations and financial elements. Research proposes that local differences in vehicle deals can be affected by variables, for example, pay levels, socioeconomics, and social inclinations.
Diverse Model Offerings and Consumer Choices
Clarification: The different scope of vehicle models and their individual deals counts highlight the significance of taking care of a wide exhibit of buyer inclinations. Writing underscores the requirement for makers to adjust their item portfolios to developing shopper tastes to keep up with intensity (Sankaran et al., 2023).
Gender Disparities in Car Purchases
Clarification: The huge contrast in vehicle acquisitions among guys and females prompts a more profound investigation of orientation explicit buyer conduct. Studies demonstrate that orientation based showcasing systems and item situating assume an essential part in impacting vehicle purchasing choices.
Year-wise Trends Reflect Market Dynamics
Clarification: The noticed patterns in vehicle deals over various years feature the powerful idea of the auto market. Research recommends that variables like financial circumstances, mechanical progressions, and administrative changes add to vacillations in yearly deals designs
Top Purchased Car Brands and Market Positioning
Clarification: The strength of explicit brands in the market highlights the meaning of brand notoriety and shopper dedication. Existing writing accentuates the job of powerful brand the executives and key promoting in impacting vehicle buying choices
4. Recommendations
The key findings from the analysis of the car sales dataset lead to the following concise and practical recommendations for industry stakeholders:
Regional Targeting Strategies
Recommendation: Implement region-specific marketing strategies based on the observed disparities in car sales across different regions. Tailoring promotions and incentives to align with regional preferences and economic conditions can enhance market penetration.
Diversification of Model Offerings
Recommendation: Respond to the diversity in consumer preferences by continuously diversifying and updating the model offerings. These kinds of research often helps in making long term growth of a company. It should happen regularly.
Gender-Inclusive Marketing Campaigns
Recommendation: Companies can make women driven campaigns that can bring more women buyers on the table with also focusing on promoting the male trend. That can help in making balance.
Yearly Sales Forecasting and Planning
Recommendation: Looking at the dynamic sales over the years of 2016, 2017, and 2018 one thing is sure that the market is uncertain and involves factors that affects the growth. Patterns can be made using these.
Brand Strengthening Initiatives
Recommendation: Brands driven campaigns can be made for the companies which are not popular as the data shows. And to the top 5 brands one thing is sure they can spend least on promotion and more on quality.
5. Conclusion
The analysis makes a clear image of data works for car sellers in the U.S. Knowledge in the field can assure brand building and promotion that can attract more customers. This showcase the importance of data analysis and business application.
Makers and dealers relationship is crucial in building the brand from top to bottom as the data suggests. The area with a good dealer has more sales.
Annual trends suggests that there is need of planning not a generalized but specific one. Additionally, the dominance of specific brands underscores the significance of brand management and positioning for sustained market leadership.
The recommendations derived from the key findings provide practical and actionable strategies for manufacturers and dealerships to enhance their market presence, optimize resources, and better cater to consumer needs.
In conclusion, the analysis equips industry stakeholders with valuable insights to navigate the dynamic landscape of the automotive market, fostering informed decision-making and strategic planning for sustained success.
References
1. Mezmir, E.A., 2020. Qualitative data analysis: An overview of data reduction, data display, and interpretation. Research on humanities and social sciences, 10(21), pp.15-27.
2. Zerbino, P., Stefanini, A. and Aloini, D., 2021. Process science in action: A literature review on process mining in business management. Technological Forecasting and Social Change, 172, p.121021.
3. Duan, Y., Cao, G. and Edwards, J.S., 2020. Understanding the impact of business analytics on innovation. European Journal of Operational Research, 281(3), pp.673-686.
4. Runkler, T.A., 2020. Data analytics. Wiesbaden: Springer Fachmedien Wiesbaden.
5. Palepu, K.G., Healy, P.M., Wright, S., Bradbury, M. and Coulton, J., 2020. Business analysis and valuation: Using financial statements. Cengage AU.
6. Kronthaler, F., 2022. Statistics applied with excel: data analysis is (not) an art. Springer Nature.
7. McFedries, P., 2022. Excel data analysis for dummies. John Wiley & Sons.
8. Mustafy, T. and Rahman, M.T.U., 2024. Excel. In Statistics and Data Analysis for Engineers and Scientists (pp. 81-134). Singapore: Springer Nature Singapore.
9. Grenci, R.T., 2022. Introducing business analytics in context: An Excel project to analyze product and sales data for inventory purchase decisions. Decision Sciences Journal of Innovative Education, 20(4), pp.190-200.
10. Sankaran, S., Sankaran, K. and Bui, T., 2023. Student satisfaction with R vs. Excel in Data Mining and Business Analytics: A Herzberg's motivation?hygiene theory perspective. Decision Sciences Journal of Innovative Education, 21(2), pp.68-82.
Would you like to schedule a callback?
Send us a message and we will get back to you


Highlights
Earn While You Learn With Us
Confidentiality Agreement
Money Back Guarantee
Live Expert Sessions
550+ Ph.D Experts
21 Step Quality Check
100% Quality
24*7 Live Help
On Time Delivery
Plagiarism-Free

 81 Isla Avenue Glenroy, Mel, VIC, 3046 AU


