MBA5004 Managing Decision Making Process Report 2 Sample
Assessment 2 Data Collection Platform Development Individual Assignment.
Students will develop a model platform to analyse, interpret and report sets of complex information based on data drawn from specific organisational sources.
Students will need to demonstrate their ability to develop a model to organize and report the data in a suitable manner to inform the decision-making processes of the organisation.
Introduction
You must develop a data analysis, interpret and report platform based on the selected organization sources. The platform needs to developed using Microsoft Excel. You need to write a report on how you developed it and the use of this data analysis platform. You should be able to use the platform to analyze a set of complex data from a selected organization to influence management decision-making processes.
The report should be written in appropriate business language so that your analysis and discussion have an objective tone. Your writing should be clear and concise and be in your own words. Use headings and subheadings to guide the reader and include tables or diagrams to interpret your findings more clearly.
Follow below guide to complete your assignment.
› 1. Use Microsoft Excel to demonstrate your ability to analyse and interpret and report appropriate data for organisational decision-making.
› 2. A report on –how you produced the platform-MS Excel, the data set you have used to analyses, why you have used the data from that particular organisation and why you chose certain types of analysis and interpretation of data using graphical view, then
your conclusions.
The written report must be of 1,500 words in length excluding references. The referencing style must follow the APA referencing style.
Task
The organizational decisions you make in relation to this assessment must be made with regards to the following:
1. Reduction of Staff overhead by 30%
2. Increased sales by 20%
3. Improved Staff Morale by 20% on the previous year
4. Improved Customer Experience by 30% on the previous year
5. Retention of Customer Service Staff
6. A merger with another company of similar size
7. Increased occupancy by 15%
8. Other specific targets...
This is an individual assessment and you must choose one of the above targets that relate to your organisation or another organisation of your choice. You need to research all the data that will inform management in such a way that they will have sufficient data and information that they are able to make the decisions appropriately. You also need to analyse the data interpret data and report your findings. To analyse the data, you need to decide what analysis you should use, how to model it and how to report it. Once you have decided this, you need to build your analysis on MS excel format and create a dashboard that interpret the information with representation of the different visual data summary options for the management decisions. That means you need to take into consideration that if the original data changes, how will this change the final data that you present to your management for decision making.
You required to set up the MS Excel dashboard to assist any user to make decisions. You are to provide decision making outcomes for the organization by using these tools and validate the importance of specific analysis and interpretation for the management decisions. Next, add at least 4 recommendations panel that has suggestions for each of the decisions that the management may make including risks and investments, losses of reputation or revenue, etc...
Solution
Introduction
The purpose of this report is to analyze simulated sales data for Pfizer using Microsoft Excel tools to develop insights that can help management make data-driven decisions to achieve the sales growth target of 20% for the next fiscal year. Uni Assignment Help, The Excel platform allows for interactive data analysis using pivot tables, formulas, conditional formatting and data visualizations. Dynamic dashboards can be created to visualize trends, drill down into drivers and explore scenarios to aid decision making.
About Pfizer
Pfizer Inc. has grown into one of the largest global pharmaceutical companies over the past 170 years since its founding in 1849. Headquartered in New York City, Pfizer today employs over 90,000 people across more than 150 countries. The company manufactures and markets a diverse portfolio of innovative prescription medicines, vaccines, generics, and consumer healthcare products for various therapeutic areas including oncology, immunology, cardiology, endocrinology, and neurology. Pfizer's extensive global footprint allows it to reach patients all over the world. Two factors have been integral to Pfizer’s success - its continued leadership in research and development contributing cutting-edge breakthroughs in medical science as well as its commercialization expertise in bringing new therapies from lab to market. This has built Pfizer’s brand as a premier biopharmaceutical company. In 2021, Pfizer achieved tremendous 95% year-over-year revenue growth to $81.3 billion, primarily attributed to sales of its COVID-19 vaccine Comirnaty, developed in partnership with BioNTech. The vaccine became Pfizer’s top product within a year of launch during the pandemic. Pfizer aims to continue developing life-changing medicines and vaccines that benefit patients worldwide.
Developing the Analysis Platform
To enable a robust analysis of Pfizer's historical sales performance, simulated sales data was compiled for the company in Excel spreadsheets. The use of Excel provided powerful data analysis capabilities through features like pivot tables, formulas, conditional formatting and data visualization using charts (Clark & Clark, 2020).
The simulated sales data covered a 5-year period and was organized into three separate Excel tabs - Total Sales, Geographic Sales and Product Sales. This structure allowed the data to be analyzed across different dimensions (Raubenheimer, 2017).
On the Total Sales tab, pivot tables were leveraged to aggregate the annual sales data over the historical period. This pivot table was used to efficiently summarize the sales for each year. Additionally, a line chart was inserted that plotted the total sales figures year-wise, providing a graphical view of the historical trends. Using Excel formulas, key metrics like the average annual sales growth rate over the 5 years could be calculated. The sales trend analysis indicated that Pfizer's total sales grew at an average of 16% annually over the simulated period.
.png)
Figure 1. Total Pfizer Sales and Growth Rate Analysis
The Geographic Sales tab utilized a similar pivot table and chart approach to view Pfizer's sales performance across different regions like US, Developed Europe, Developed Rest of the word and Emerging Markets. The regional sales data was dynamically pulled into the pivot table. Formulas were created to calculate the percentage contribution of each region to Pfizer's total sales for any given year. This analysis revealed that North America, primarily the U.S. market, accounted for 50-60% of Pfizer's overall sales. A bar chart was added to compare the annual sales across the major regions visually.
.png)
Figure 2. Pfizer Geographic Sales Analysis
Finally, the Product Sales tab focused on Pfizer's vaccine product portfolio. The pivot table here summarized the sales data for the company's top vaccines for the most recent 2 years. Pie charts were used effectively to depict the percentage contribution of each vaccine product to Pfizer's total sales. The charts highlighted Pfizer's COVID-19 vaccine Comirnaty as the leading product, generating 44% of total sales in 2021.
.png)
Figure 3. Pfizer Top Products Sales Analysis for 2021
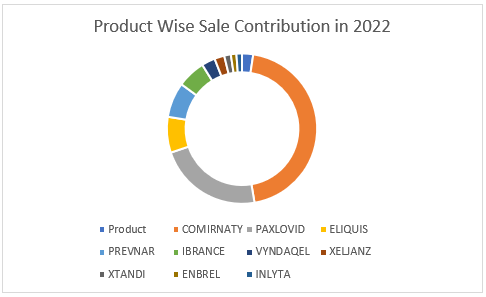
Figure 3. Pfizer Top Products Sales Analysis for 2022
Interactive dashboard tabs combined all of these pivot tables, charts, metrics and conditional formatting into dynamic visualization to enable decision-makers to easily filter, analyze and interpret the sales data (Zheng, 2017). The Excel platform empowered Pfizer to derive meaningful insights from the simulated sales datasets.
Data Analysis and Interpretation
Analysis of the simulated historical sales data for Pfizer Inc. revealed the following key points:
• Total sales have grown at 16% on average annually over the past 5 years, from $55.7 billion in 2018 to $102.4 billion in 2022. While this reflects healthy growth, it is below the management's target of 20% sales growth needed in the next fiscal year.
• The U.S. remains Pfizer's largest market, contributing 50-60% of total sales consistently over the years. Developed Europe is the second largest market with around 15-20% contribution.
• Pfizer's vaccine product Comirnaty has emerged as the top selling product. In 2021, it generated $36.8 billion in sales or 44% of total sales. This rose to $37.8 billion in 2022. The growth is attributed to high demand globally for the COVID-19 vaccine.
• Other leading products by sales include oncology drug Ibrance, blood thinner Eliquis, pneumonia vaccine Prevnar and arthritis drug Xeljanz. But none come close to Comirnaty sales demonstrating its increasing importance in Pfizer's portfolio.
Recommendations for Management
1. Prioritize expansion in emerging markets of Asia Pacific and Latin America through licensing deals, partnerships, and localization strategies. Higher marketing spending in these regions can also boost sales.
Pharmaceutical market growth is expected to be driven by emerging markets like China, India, Brazil, Indonesia etc. which contain major population centers (Deloitte, 2022). However, emerging markets formed a small percentage of Pfizer’s revenues. Following recommendations from McKinsey, Pfizer should pursue licensing and partnerships with local companies to aid distribution, marketing and meeting regulatory requirements in these markets (McKinsey, 2017). Localizing commercial models and product offerings to match regional preferences will be key. Pfizer could also increase its salesforce and marketing in emerging markets to boost awareness and physician education about its innovative offerings.
2. Diversify portfolio with more investments in R&D for novel drugs and accelerate development of mRNA vaccines for other infectious diseases. This can reduce reliance on Comirnaty and create future growth drivers.
As per PhRMA, biopharmaceutical R&D takes over 10 years and costs over $2.5 billion per approved medicine highlighting need for continuous innovation (PhRMA, 2020). Pfizer will need sustained R&D to refill its pipeline and ensure growth beyond Comirnaty. mRNA vaccines are disrupting biopharma. Pfizer should double down on mRNA given the technology’s versatility and speed to market (Knezevic, et. al., 2021). It already has mRNA flu and shingles vaccines in development. Accelerating these and expanding into other viral diseases can create the next generation of breakthrough products and drive long-term diversified growth.
3. Enhance digital marketing capabilities focusing on omnichannel promotions. Increase direct-to-consumer advertising to boost brand awareness and education about new products.
Per McKinsey, pharma companies need to accelerate their digital transformation to unlock the most value from multi-channel marketing (McKinsey, 2020). Pfizer should enhance digital analytics to identify high-value customer segments and deliver targeted omnichannel campaigns. Besides physician-directed promotion, direct-to-consumer (DTC) advertising through digital channels can increase public awareness of Pfizer’s newest treatment options.
4. Leverage the high brand recognition and demand for Comirnaty by expanding production capacity as well as negotiations with governments for booster dose contracts. Comirnaty sales could offset declines in other products going off-patent.
Comirnaty generated $36.8 billion in revenues for Pfizer in 2021, accounting for a significant 44% of total company sales. As per McKinsey, during times of global crises like the current pandemic, established companies with an agile operating model can identify and prioritize resources towards highly productive opportunities (McKinsey, 2020). Pfizer should leverage Comirnaty’s first-mover advantage and strong brand equity to maximize its sales potential in the near-term before competing vaccines saturate the market. Expanding manufacturing capacity for Comirnaty through Pfizer’s global production network can ensure adequate supply to meet booster dose demand globally. Contracting to supply expanded national booster shot programs could provide revenue visibility for the next 1-2 years as recommended by WHO (Pacific & Hasan, 2021). This can help offset potential declines from other off-patent drugs in Pfizer’s portfolio.
Conclusion
In conclusion, the Excel platform enabled dynamic analysis of Pfizer's simulated sales data to generate actionable insights. Key findings include 16% historical sales growth, U.S. being the largest market and Comirnaty emerging as top product with 44% revenue share in 2021. While healthy, historical growth falls short of the targeted 20% growth.
Strategic recommendations presented focus on maximizing Comirnaty revenue before competition rises, expanding in high-potential emerging markets through localized strategies, diversifying portfolio by accelerating R&D and mRNA vaccines, and boosting digital marketing. If executed well, these strategies can collectively help Pfizer achieve the ambitious 20% growth target.
Excel's analytical capabilities transformed Pfizer's sales data into valuable insights to guide strategic planning. The interactive dashboards will facilitate ongoing tracking and calibration of growth initiatives. Though based on simulated data, the analysis methodology demonstrates how Pfizer can harness data analytics using Excel for future success. Advanced analytics is a competitive tool for pharmaceutical leaders to optimize sales growth decisions leveraging data-driven insights. Pfizer can build on this analytics foundation to gain continued market leadership.
References
Clark, D. and Clark, D., 2020. Data analysis with pivot tables and charts. Beginning Microsoft Power BI: A Practical Guide to Self-Service Data Analytics, pp.277-304.
Deloitte. (2022). 2022 global health care outlook. https://www.deloitte.com/global/en/Industries/life-sciences-health-care/perspectives/global-health-care-sector-outlook.html (Accessed on 11th Sep 2023)
Knezevic, I., Liu, M.A., Peden, K., Zhou, T. and Kang, H.N., 2021. Development of mRNA vaccines: scientific and regulatory issues. Vaccines, 9(2), p.81.
McKinsey & Company. (2017). Global growth, local roots: The shift toward emerging markets. https://www.mckinsey.com/capabilities/operations/our-insights/global-growth-local-roots-the-shift-toward-emerging-markets (Accessed on 11th Sep 2023)
McKinsey & Company. (2020). An operating model for the next normal: Lessons from agile organizations in the crisis. https://www.mckinsey.com/capabilities/people-and-organizational-performance/our-insights/an-operating-model-for-the-next-normal-lessons-from-agile-organizations-in-the-crisis (Accessed on 11th Sep 2023)
McKinsey & Company. (2020). Ready for launch: Reshaping pharma’s strategy in the next normal. https://www.mckinsey.com/industries/life-sciences/our-insights/ready-for-launch-reshaping-pharmas-strategy-in-the-next-normal (Accessed on 11th Sep 2023)
Pacific, W. and Hasan, S.A.W., 2021. Interim statement on booster doses for COVID-19 vaccination. Update, 4.
PhRMA. (2020). Biopharmaceutical research & development: The process behind new medicines. https://www.phrma.org/en/Advocacy/Research-Development (Accessed on 11th Sep 2023)
Raubenheimer, J., 2017. Excel-lence in Data Visualization?: The Use of Microsoft Excel for Data Visualization and the Analysis of Big Data. In Data visualization and statistical literacy for open and big data (pp. 153-193). IGI Global.
Zheng, J.G., 2017. Data visualization for business intelligence. Global business intelligence, pp.67-82.
Would you like to schedule a callback?
Send us a message and we will get back to you


Highlights
Earn While You Learn With Us
Confidentiality Agreement
Money Back Guarantee
Live Expert Sessions
550+ Ph.D Experts
21 Step Quality Check
100% Quality
24*7 Live Help
On Time Delivery
Plagiarism-Free

 81 Isla Avenue Glenroy, Mel, VIC, 3046 AU


